Introduction
Are you looking for a tool that helps you to monitor your company health and improve your business? In any business, Reports are an important tool to show you how your company is performing and help you to achieve your goals. Looking at reports allows you to take quick conclusions about your company’s health and act immediately to solve problems and improve your business results. They are an essential tool for any company regardless of size or industry.
Salesforce offers a powerful tool to help you to visualize, analyse key business metrics and make decisions. With Salesforce Reports you can access all the data in Salesforce, display in graphical charts and create Dashboards.
Salesforce Reports are lists of records that are in Salesforce, displayed in rows and columns. These lists can be filtered, to limit the data returned, and grouped. Also, we can add/remove fields and create formulas based on what you want to see. Reports are stored in a folder and folders can be public, hidden or shared and can be set to read-only or read/write.
Reports Types
The first step to create a report in Salesforce is to choose the report type. When creating a report, Salesforce offers a standard Report Types for all standard objects and, in case of custom objects, Salesforce automatically creates standard report types adding “with” or “and” relationship. Usually, these Report Types meet the user’s common needs.
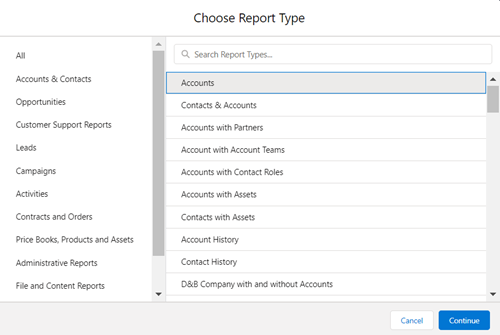
However, sometimes, we can have some limitations using standard Report Types. This type of Reports may not be sufficient to achieve the reports that you need and, in this case, we can explore Custom Report Types.
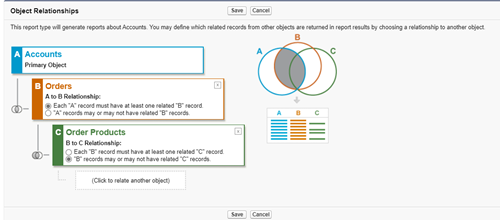
With Custom Report Types, we are able to associate up to four objects that have a parent-child relationship and create a report that meets the user needs. Furthermore, for each child object, you can select if:
- Each “A” record must have at least one related “B” record, i.e., only parent records with child records are shown in the report.
- “A” records may or may not have related “B” records, i.e., all parent records are shown in the report.
Let’s see an example: if you want to have a report on Accounts with Orders and Order Products, Account will be the primary object, then we need to add a relationship with Orders and finally a relationship with Order Products. In this case, the report will contain records of Accounts with Orders, with or without Order Products.
Report Format
After choosing the report type, it is possible to build 4 different formats of reports:
- Tabular reports, which is the default format and returns a simple list of records.
- Summary reports, similar to tabular reports but in which you can group and summarize by columns.
- Matrix reports, that are similar to summary reports but allows you to group and summarize by both rows and columns.
- Joined reports, which consists of adding up to 5 blocks of reports, in a single report. You can add standard and custom report types, if they are related to the same object or objects. Each block works as an individual report, you can adjust filters, add/remove fields, create formulas and sort columns. To grouping blocks are used common fields, that are fields shared by all report types.
Additionally, it is possible to implement different formula types to help calculate values. These are the different types of report formulas:
- Row-Level formula, that calculate values on every report row
- Summary formula, which requires at least one group, evaluate data in groups
- Cross-Block summary formula, only available in joined reports, allows you to calculate values across multiple blocks of reports
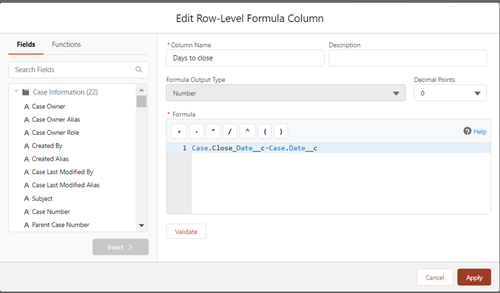
Here is an example of using a Row-Level formula. In this case, this formula calculates how many days it takes a Case to close.
In addition to formulas, we can quickly categorize records and create groups without needing to create custom fields. Bucket columns, allows you to define multiple categories and group your records and, like any other column, it is possible to sort, filter and group by a bucket column.
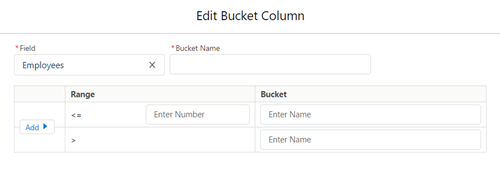
For example, if you want to categorize accounts based on the number of employees, we can use a bucket column to define a range and categorize the accounts based on the field Employees.
Reporting Snapshot
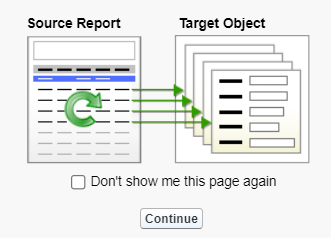
Now, imagine that you want to keep information to see the data changes over the time. That is, you want to create a report about historical data. The solution is Reporting Snapshot, where reports are saved in a custom object. For this, it is necessary to create:
- Source report - The first step is to create a report on the object you want to keep the information and this will be the source report.
- Target Object - Then you need to create a target object (custom object) and custom fields, of the same type as the columns of source report, to map data from the Source Report to Target Object. The information will be kept in this object.
- Reporting Snapshot - Create a reporting snapshot, set mapping fields from the source report to target object and schedule reporting snapshot. When the reporting snapshot is executed, the data from the source report will be loaded in the target object, according to field mapping, and thus, the historical data will be saved.
- Lastly, you will be able to create a report on the target object and see a report about historical data
For example, let’s assume you want to build a report that shows the evolution of the lost opportunities rate over the year. That is, you want to keep the lost opportunities rate of each month of the year and see the evolution of this rate.
First, we need to create a report that gives you the lost opportunity rate of the month. Then, we will create a target object and the respective custom fields to save this information. The next step is creating a reporting snapshot, where we will map the columns of the source report to the target object, and schedule it to execute on the last day of every month. Lastly, we will create a report on the target object to show the evolution of the rate over the year.
Schedule Reports
After creating all the reports, you can subscribe to the most important reports in case you want to receive notifications about them without needing to execute. When subscribing to the reports, it is possible to choose:
- The frequency to execute them - Daily, Weekly, Monthly,
- Week days and time,
- Attach file,
- Email recipients,
- Conditions to notify users
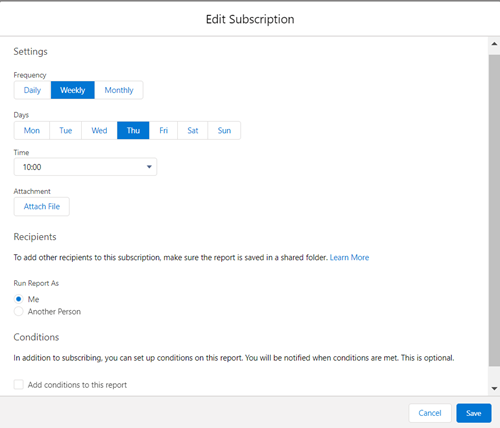
It can be useful if, for example, you have to look at the results every week on the same day. You can schedule to receive an email with the results updated in time, every week on the same day.
Charts and Dashboards
All the information in your report can be displayed in a chart. Salesforce makes available different charts that we can add to your reports depending on the requirement. When adding a chart you can choose to display as: bar, column, stacked bar, stacked column, line, donut, funnel and as a scatter plot.
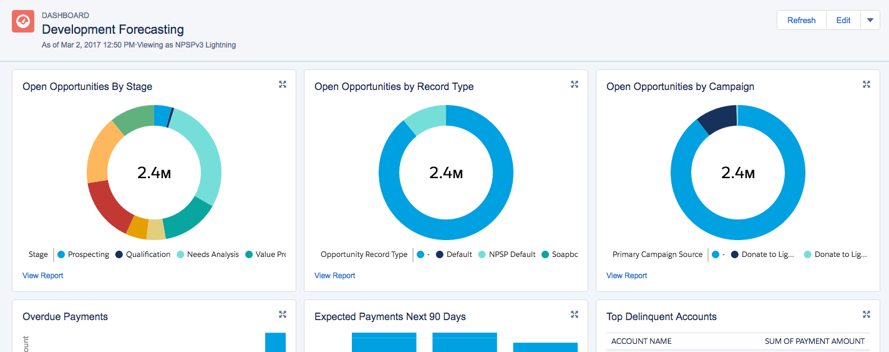
Furthermore, you can gather the reports in graphical format in a Dashboard and, thus, have all the information side by side. Dashboard components are powered by reports and have a more variety of chart types. You can choose to display as: horizontal/vertical bar chart, stacked horizontal/vertical bar chart, line chart, donut chart, metric chart, gauge chart, funnel chart, scatter chart and as a table. Here is an example of a dashboard with some reports you can have about your business as number of leads by lead source, number of leads converted and number of won opportunities.

Conclusion
As you can see, Salesforce Reports are a very useful tool to help you to solve your problems and improve your business. You can have all your information updated in time and, thus, take quick conclusions about what to change and improve to achieve your goals faster.
#Salesforce #SalesforceReports #Dashboards #worldIT
